RC Aircraft Aerodynamic Modeling and Experimental Validation
Developed a Python model of RC aircraft aerodynamics to describe real world data.
Abstract
This project presents a physics‑based aerodynamic model for predicting the performance of a radio‑controlled (RC) aircraft using motor wattage, propeller characteristics, and experimentally measured aerodynamic data. The model incorporates NASA propeller momentum theory, a fitted relationship between motor power and exhaust velocity, and a drag model based on aircraft geometry. Experimental data were collected using a custom test setup in which the aircraft was mounted to a vehicle to simulate forward airspeed. Model predictions were validated against GPS‑derived flight telemetry, achieving steady‑state velocity accuracy within approximately 3–6% across power levels from 200 W to 800 W.
1. Introduction
The objective of this project was to develop a dynamic simulation capable of predicting the flight behavior of an RC aircraft as a function of motor wattage and oncoming airspeed. The simulation computes thrust, drag, acceleration, velocity, and position over time using a time‑stepped numerical model implemented in Python. To obtain the necessary aerodynamic data, the aircraft was instrumented with GPS telemetry and mounted to a vehicle to simulate controlled forward airspeeds. Exhaust velocity (Ve) was measured at multiple wattages and speeds, enabling the construction of a fitted model for Ve as a function of power and flight velocity. This approach was required due to the lack of access to a wind tunnel and the known decrease in propeller efficiency with increasing airspeed.
The resulting model was compared to real flight data to assess accuracy and identify limitations.
2. Methodology
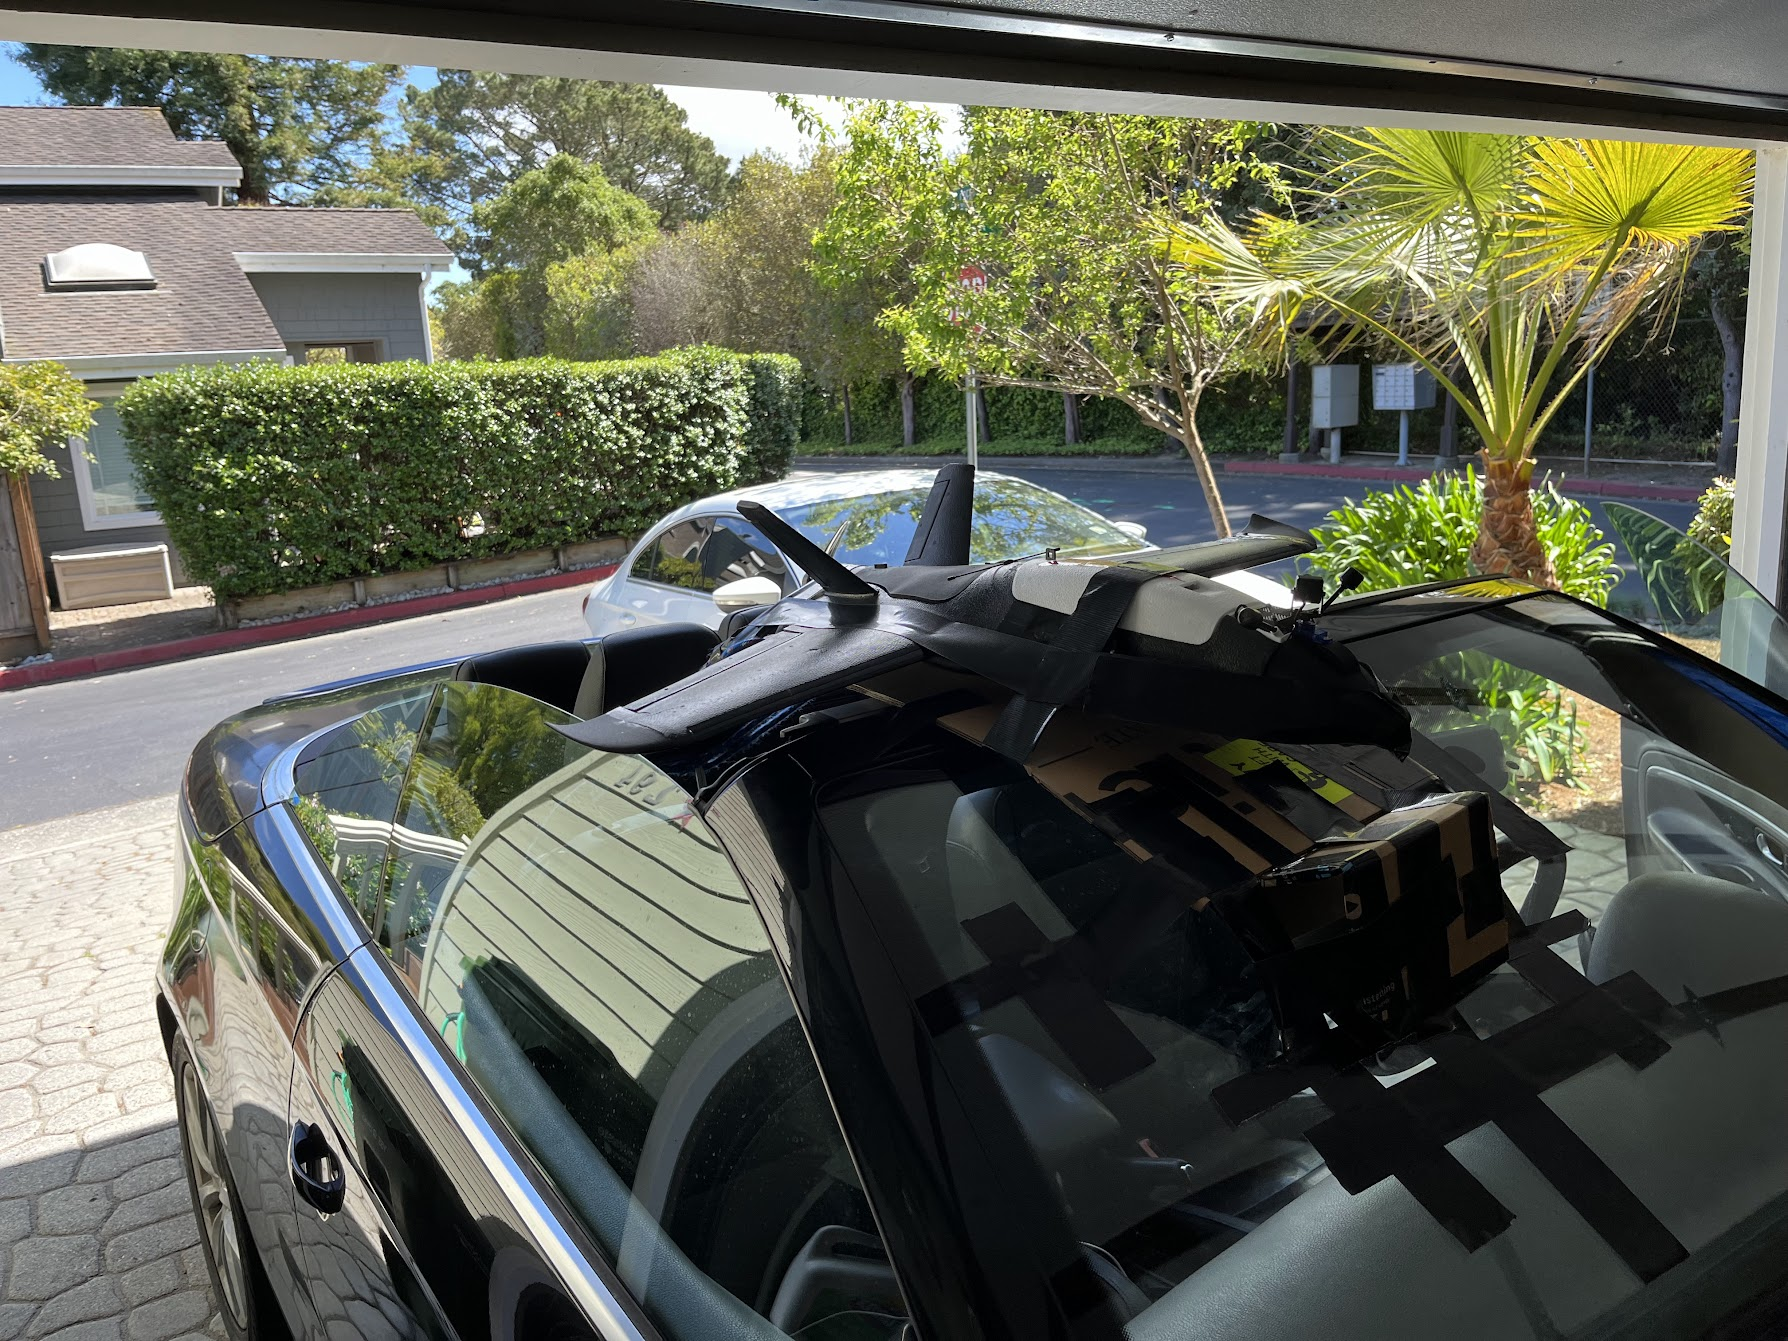
2.1 Data Collection
A combination of sensors and telemetry systems were used:
- GPS module for velocity, acceleration, and position
- Digital anemometer for oncoming airspeed (Vo)
- Pitot tube for exhaust velocity (Ve)
- ESC telemetry for motor wattage
- Vehicle‑mounted test rig to simulate controlled airspeeds
This setup enabled measurement of Ve at multiple wattages and airspeeds, which is essential for modeling propeller efficiency loss.
2.2 Thrust Model
The thrust model is based on NASA’s propeller momentum theory:
Where:
- (air density)
- (propeller disk area)
- = exhaust velocity
- = oncoming airspeed
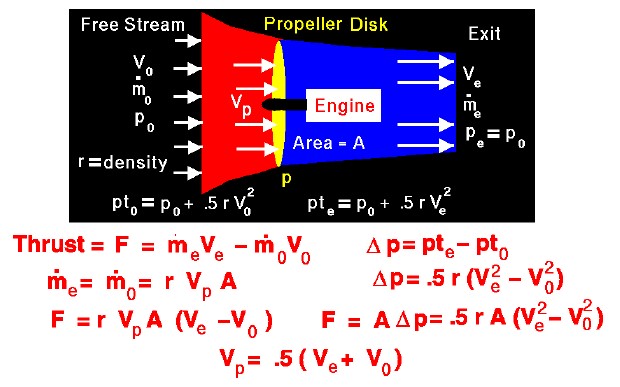 Thrust equations from nasa.gov.
2.3 Exhaust Velocity Model
Exhaust velocity was modeled using a logarithmic curve fit derived from experimental data:
Where is motor wattage. This formulation captures both the increase in exhaust velocity with power and the reduction in effective thrust as airspeed increases.
2.4 Drag Model
Drag was modeled using:
Where:
- (drag coefficient; tested range 0.07–0.20)
- (frontal area)
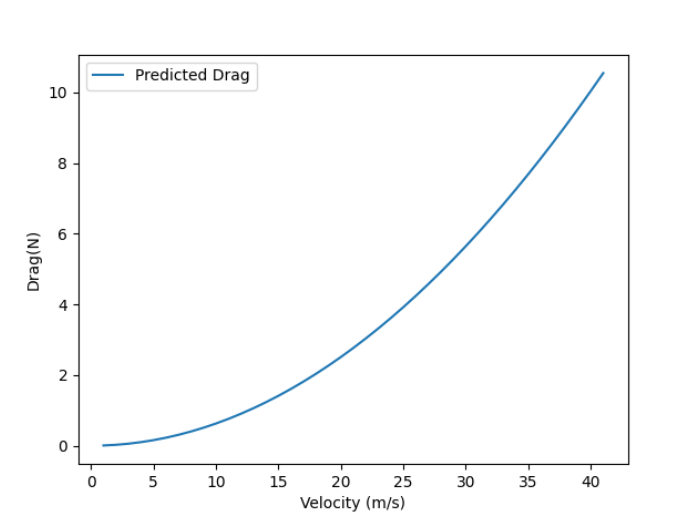 Drag model behavior as a function of airspeed.
2.5 Dynamic Simulation
The aircraft’s motion was simulated using:
Where:
All computations were performed in Python using NumPy, SciPy, and Matplotlib.
3. Experimental Data
Exhaust velocity measurements were collected at multiple wattages and airspeeds. These data were used to construct the fitted model. Additional static tests provided Ve vs. wattage relationships for curve fitting.
GPS telemetry from actual flights was used to validate predicted velocity and position over time.
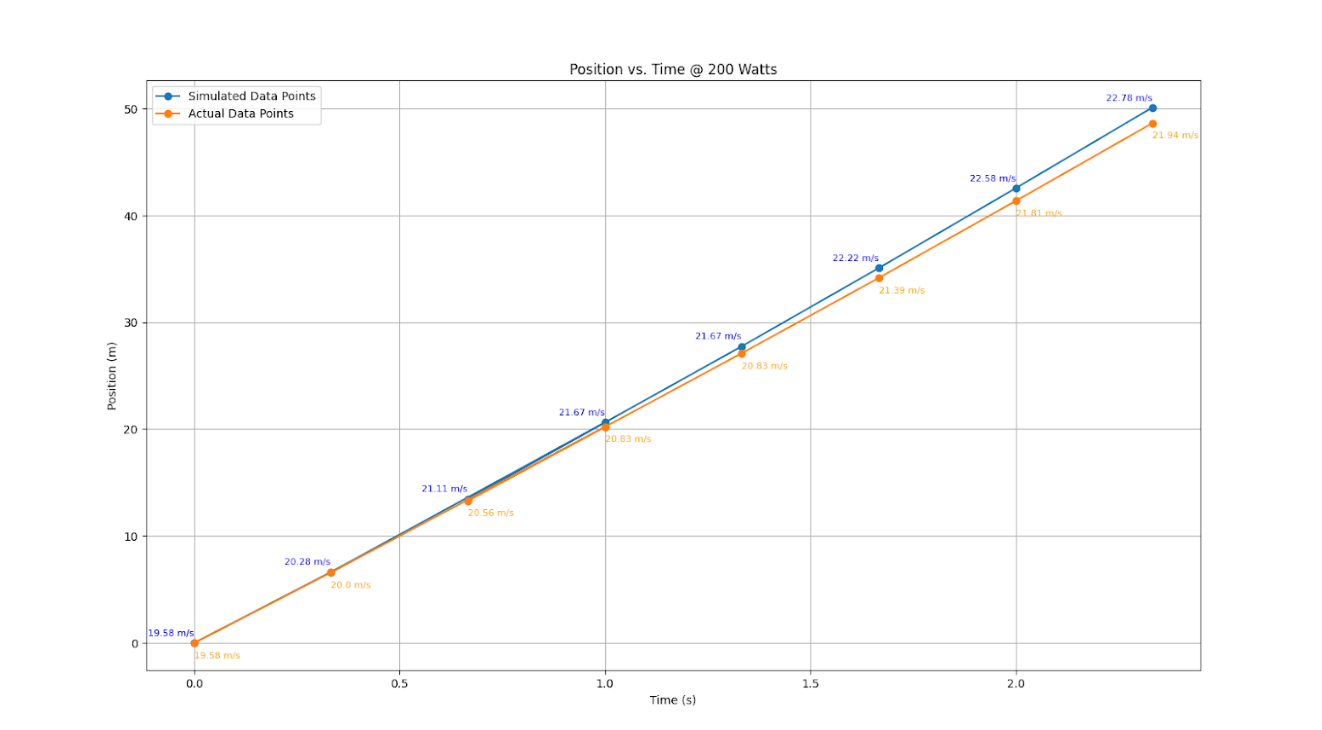 Example: simulated vs actual velocity at 200 W.
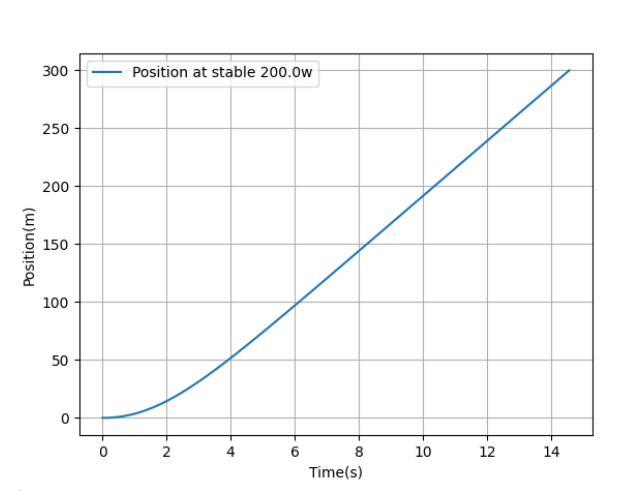
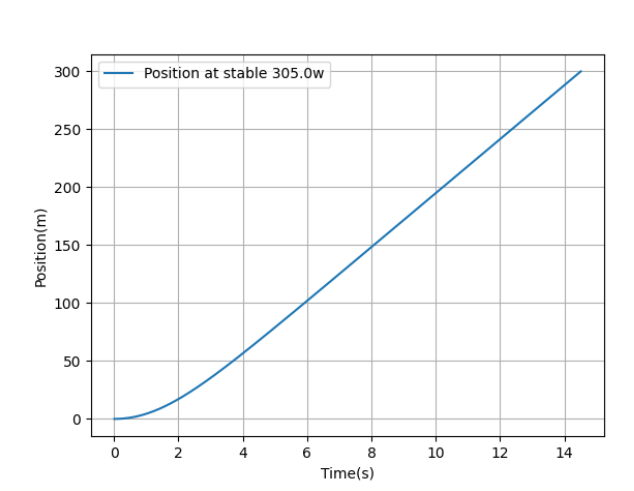
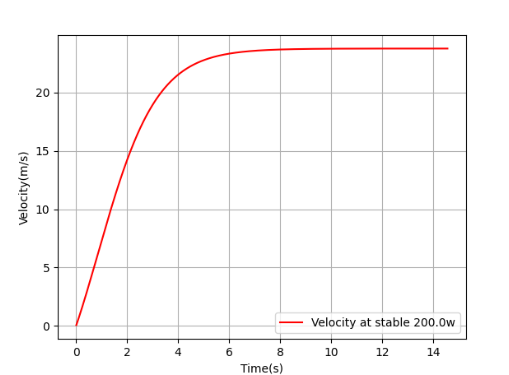
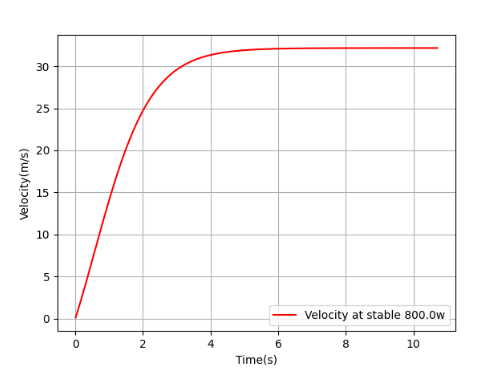
4. Results
4.1 Steady‑State Velocity Comparison
The model was evaluated at three power levels:
| Power (W) | Predicted Velocity (m/s) | Actual Velocity (m/s) | Error |
|---|---|---|---|
| 200 | 24.3 | 23.1 | 5.2% |
| 305 | 27.2 | 25.6 | 6.3% |
| 800 | 33.1 | 33.3 | 0.6% |
The simulation consistently converged to steady‑state velocities close to the measured values.
4.2 Transient Behavior
The model accurately predicts the qualitative shape of the velocity curve: rapid initial acceleration followed by diminishing acceleration as drag increases and thrust decreases with airspeed.
Due to limited high‑resolution acceleration data, transient accuracy beyond the first few seconds is less reliable. Position‑versus‑time comparisons show close agreement initially, with divergence increasing over time.
5. Discussion
The model successfully captures the key aerodynamic behaviors of the aircraft, including:
- Reduction in propeller thrust with increasing airspeed
- Quadratic drag growth
- Diminishing acceleration approaching terminal velocity
Steady‑state predictions were highly accurate, demonstrating the validity of the thrust and drag models. The primary sources of error include:
- Uncertainty in drag coefficient
- Limited transient acceleration data
- Approximate frontal area measurement
- Absence of wind‑tunnel‑quality Ve vs. Vo data
Despite these limitations, the model performs well for performance prediction and provides a strong foundation for future refinement.
6. Conclusion
A physics‑based RC aircraft simulation was developed and validated using experimental data. The model accurately predicts steady‑state velocity across a wide range of power levels and provides realistic dynamic behavior. The methodology demonstrates that meaningful aerodynamic modeling can be achieved using accessible instrumentation and field testing.
Future improvements include refined drag characterization, expanded Ve measurements, and controlled wind‑tunnel testing.
Acknowledgements
This project was carried out primarily by Teo Schnell (majority of the modeling, experiments, and analysis). Johann Kaufmann contributed assistance on portions of the experiments and analysis. Chris Chavez provided feedback and editorial help.
References
- NASA Glenn Research Center — Propeller Thrust.
- RcPlaneSim GitHub repository: https://github.com/taschnell/RcPlaneSim.
Data Validation Flight
Photo gallery